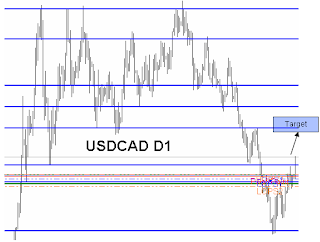
The USDJPY right now trading just above the long term support level at 94.55, take a look at the chart below:

As long as the market keeps trading above the short term resistance level (95.13) I will look for long opportunities. An eventual break should take the market to 96.22
As long as the market keeps trading below the short term support level (94.61) I will look for short opportunities. An eventual break should take the market to 92.14
If the market keeps trading in between the short term range 95.13 and 94.61 I will do nothing.


