Calendar

How to take a loss

There are quite a few books written on how to make money in the market. Some of them are even written by people who have made money as traders! What you don't see often, however, are books or articles written on how to lose money. "Cut your losers and let your winners run" is commonsensical advice, but how do you determine when a position is a loser? Interestingly, most traders I have seen don't formulate an answer to this question when they put on a position. They focus on the entry, but then don't have a clear sense of exit-especially if that exit is going to put them into the red.

One of the real culprits, I have to believe, is in the difficulty traders have in separating the reality of a losing trade from the psychological sense of feeling like a loser. At some level, many traders equate losing with being a loser. This frustrates them, depresses them, makes them anxious-in short, it interferes with their future decision-making, because their P & L is a blank check written against their self-esteem. Once a trader is self-focused and not market focused, distortions in decision-making are inevitable.

A particularly valuable section of the classic book Reminiscences of a Stock Operator describes Livermore 's approach to buying stock. He would sell a quantity and see how the stock responded. Then he would do that again and again, testing the underlying demand for the issue. When his sales could not push the market down, then he would move aggressively to the buy side and make his money.

What I loved about this methodology is that Livermore's losses were part of a grander plan. He wasn't just losing money; he was paying for information. If my maximum position size is ten contracts in the ES and I buy the highs of a range with a one-lot, expecting a breakout, I am testing the waters. While I am not potentially moving the market in the way that Livermore might have, I still have begun a test of my breakout hypothesis. I then watch carefully. How are the other averages behaving at the top ends of their range? How is the market absorbing the activity of sellers? Like any good scientist, I am gathering data to determine whether or not my hypothesis is supported.

Suppose the breakout does not materialize and the initial move above the range falls back into the range on some increased selling pressure. I take the loss on my one-lot, but then what happens from there?

The unsuccessful trader will respond with frustration: "Why do I always get caught buying the highs? I can't believe "they" ran the market against me! This market is impossible to trade." Because of that frustration-and the associated self-focus-the unsuccessful trader does not take any information away from that trade.

In the Livermore mode, however, the successful trader will see the losing one-lot as part of a greater plan. Had the market broken nicely to the upside, he would have scaled into the long trade and likely made money. If the one-lot was a loser, he paid for the information that this is, at the very least, a range-bound market, and he might try to find a spot to reverse and go short in order to capitalize on a return to the bottom end of that range.

Look at it this way: If you put on a high probability trade and the trade fails to make you money, you have just paid for an important piece of information: The market is not behaving as it normally, historically does. If a robust piece of economic news that normally sends the dollar screaming higher fails to budge the currency and thwarts your purchase, you have just acquired a useful bit of information: There is an underlying lack of demand for dollars. That information might hold far more profit potential than the money lost in the initial trade.

I recently received a copy of an article from Futures Magazine on the retired trader Everett Klipp, who was dubbed the "Babe Ruth of the CBOT". Klipp distinguished himself not only by his fifty-year track record of trading success on the floor, but also by his mentorship of over 100 traders. Speaking of his system of short-term trading, Klipp observed, "You have to love to lose money and hate to make money to be successful.It's against human nature what I teach and practice. You have to overcome your humanness."

Klipp's system was quick to take profits (hence the idea of hating to make money), but even quicker to take losses (loving to lose money). Instead of viewing losses as a threat, Klipp treated them as an essential part of trading. Taking a small loss reinforces a trader's sense of discipline and control, he believed. Losses are not failures.

So here's a question I propose to all those who enter a high-probability trade: "What will tell me that my trade is wrong, and how could I use that information to subsequently profit?" If you're trading well, there are no losing trades: only trades that make money and trades that give you the information to make money later.

Entering Trades

Trades can be initiated in one of three ways: 1) a Market Order, 2) a Stop, and 3) a Limit.

Market Order. Placing a market order means that you will buy at your brokers current "ask" price, or sell at your brokers current "bid" price, whatever that price currently is. For example, suppose you are buying EURUSD. The current market, as quoted by your broker or on GCI's "Dealing Rates" window, is .9152/56. This means that your broker is willing to buy EURUSD from you at .9152, and sell it to you at .9156. To place a market order to buy

Click on the rate (Sell or Buy) field within the order record or right click anywhere within the order record and then choose Market order command from pop-up menu. The Amount input screen will appear:


Enter desired amount measured in lots and press OK. New order marked with letter ‘I’ (Initiate) will appear on the Trader’s Orders window. Dealer now is able to confirm operation or to reject it due to market movement.


Stop Order. Initiating a trade with a stop order means that you will only have a position if the market moves in the direction you are anticipating. For example, if USDJPY is currently 128.50 and you believe it will move higher, you could place a "buy stop" at 128.60. This means that the order will only be filled if the market moves up to 128.60. The advantage is that if you are wrong and the market moves straight down, you will not have bought (because 128.60 will never have been reached). The disadvantage is that 128.60 is clearly a less attractive rate at which to buy than 128.50. Initiating a trade with a Stop order is usually appropriate if you wish to trade only with strong market momentum in a particular direction.

On the GCI system, you can enter a trade with a stop order by right-clicking on the appropriate currency rate in the "Dealing Rates" window, and then selecting "Entry Stop" from the pop up menu. You can then input the order size and price.


Limit Order. A Limit order is an order to buy below the current price, or sell above the current price. For example, if EURUSD is trading at .9152/56 and you believe the market will rise, you could place a limit order to buy at .9145. If filled, this will give you a long position in EURUSD at .9145, which is 11 pips better than if you had just bought EURUSD with a market order. The disadvantage of this Limit order is that if EURUSD moves straight up from .9152/56, your limit at .9145 will never be filled and you will miss out on the profit opportunity even though your view on the direction of EURUSD was correct. Entering a trade with a Limit order is usually appropriate if you believe that the market will remain in a range before moving in your anticipated direction, allowing the order to be filled first.

On the GCI system, you can enter a trade with a limit order by right-clicking on the appropriate currency rate in the "Dealing Rates" window, and then selecting "Entry Limit" from the pop up menu. You can then input the order size and price.

Trading Strategy

Making trading decisions and developing a sound and effective trading strategy is an important foundation of trading.

Before developing a trading strategy, a trader should have a working knowledge of technical analysis as well as knowledge of some of the more popular technical studies. Please visit these pages for detailed information.


Sample Strategy 1 - Simple Moving Average

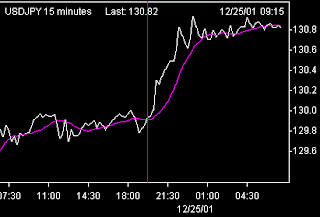
Successful trading is often described as optimizing your risk with respect to your reward, or upside. Any trading strategy should have a disciplined method of limiting risk while making the most out of favorable market moves. We will illustrate one decision making model which uses a Simple Moving Average ("SMA") technical study, based on a 12-period SMA, where each period is 15 minutes. This is one example of a trading decision making strategy, and we encourage any trader to research other strategies as thoroughly as possible.

We will use a simple algorithm: when the price of the currency crosses above the 12-period SMA, it will be taken as a signal to buy at the market. When the currency price crosses below the 12-period SMA, it will be a signal to "Stop and Reverse" ("SAR"). In other words, a long position will be liquidated and a short position will be established, both with market orders. Thus this system will keep the traders "always in" the market - he will always have either a long or short position after the first signal. In the chart below, the white line represents the price of USDJPY, the purple line represents the 12-period SMA of USDJPY, and the red line indicates where USDJPY crosses above the SMA, generating a buy signal at approximately 129.90:


This is a simple example of technical analysis applied to trading. Many strategies used by professional traders make use of moving averages along with other indicators or "filters". Note that the moving average method has an element of risk control built in: a long position will be stopped out fairly quickly in a falling market because the price will drop below the SMA, generating a stop-and-reverse signal. The same holds true for a sell signal in a rising market. Note that the SMA is generated automatically by GCI's integrated charting application.

Please review the technical studies described in this site for additional resources on developing technical trading strategy.


Sample Strategy 2 - Support and Resistance Levels

One use of technical analysis, apart from technical studies, is in deriving "support" and "resistance" levels. The concept here is that the market will tend to trade above its support levels and trade below its resistance levels. If a support or resistance level is broken, the market is then expected to follow through in that direction. These levels are determined by analyzing the chart and assessing where the market has encountered unbroken support or resistance in the past.

For example, in chart below EURUSD has established a resistance level at approximately .9015. In other words, EURUSD has risen up to .9015 repeatedly, but has been unable to move beyond that point:


The trading strategy would then be to sell EURUSD the next time it gets close to .9015, with a stop placed just above .9015, say at .9025. This would have indeed been a good trade as EURUSD proceeded to fall sharply, without breaking the .9015 resistance. Hence a substantial upside can be achieved while only risking 10 or 15 pips (.0010 or .0015 in EURUSD).

On GCI's integrated charting system (GCI Multi-Currency Charts), the red support line shown above can be drawn by clicking on the "Trend" button at the top of the chart window, and then drawing a line by clicking the mouse once at the beginning of the line, and again at the end of the line.

Hedging

Hedging is often used to control risk and to eliminate market exposure without "realizing" a loss.

For example, if a trader buys 1 lot of USDJPY, he can then eliminate his exposure to a falling USDJPY by selling a second lot. On the GCI platform, this can be done by either right-clicking on the long USDJPY position and selectingn "Hedge" position from the pop-up menu (as pictured below), or by simply selling another lot from the "Dealing Rates" window.


This will result in one long position ("B") and one short positiong ("S") in USDJPY, as shown below. Note that these two positions do not offset and cancel each other.


The trader can then manage each position separately, using stops, limits, or market orders to close each "leg" at the most opportune time.

Exiting Trades

As with entering trades, exiting trades can be done with either a "Market" order, a "Limit" order, or a "Stop" order. "Trailing Stops" are variations of stops and can also be used effectively to exit trades. Exiting trades will generally result in a loss or a gain on an open position, and should be done once you have reached your profit target, your maximum loss, or when your market view has changed.

Exiting with a Market Order. Exiting a trade with a market order means that you will sell at your brokers current "bid" price, or buy at your brokers current "ask" price, whatever that price currently is. For example, suppose you had purchased one lot of USDJPY, meaning you are long one lot. If you then assume that the current market is 127.51/55, you know that you can exit your existing long position at 127.51 (that is, sell it to close at 127.51).

On the GCI system, this is done by right clicking on the open position in the "Open Positions" window. You can then select "close position" from the pop up menu, enter the lot amount you wish to close, and click "OK".


Exiting with a Stop. Exiting a trade with a stop order means that your position will be closed after an adverse market move of a specified amount. This does not necessarily mean that you have incurred a loss on the trade (see "trailing stops" below). For example, if you had purchased 1 lot of USDJPY and it is now trading at 128.50/54, you could place a Stop at 128.20. This means that the order will only be filled if the market moves down to 128.20, limiting your loss to .30 (30 pips).

On the GCI system, you can place an order to exit a position on a Stop order by right-clicking on the position in the "Open Positions" window, and then selecting "Stop" from the pop up menu. You can then input the order size and price.

A Trailing Stop is placed in the same manner, but the concept here is that the stop will be moved as the market moves in your favor (the stop "trails" the market"). So for example, assume that you had placed your stop at 128.20 with a long USDJPY position at 128.50. If USDJPY moves up to 128.90, you could then move the stop up to 128.60. This would ensure a worse case of a gain of .10 (10 pips), while still allowing unlimited upside if USDJPY continues to rise.

The advantage of exiting with a Stop is that (1) you limit your downside to the amount you specify with your stop, and (2) you have unlimited upside in the event that the market continues to move in your favor. The disadvantage is that markets will occasionally move adversely initially, causing your stop to be filled and closing your position, and then proceed to move in the direction that you had originally anticipated.

Exiting with a Limit Order. Exiting a trade with a limit order is an effective way to ensure that you will capture profits once your profit target is reached.

On the GCI system, you can place an order to exit a position on a Limit order by right-clicking on the position in the "Open Positions" window, and then selecting "Limit" from the pop up menu. You can then input the order size and price.

The advantage of exiting a trade with a limit order is that your position will be successfully closed if your profit target is reached, even if only for a few seconds. For example, if you purchased USDJPY at 128.50 and placed a limit order to exit the trade at 129.50, you will successfully capture a 1.00 profit (100 pips) if 129.50 is reached even briefly and then the market falls again. The disadvantage is that you will limit your upside, foregoing additional gains if the market was to continue to move in your favor. Furthermore, you will not limit your downside if the market moves against you. For example, if the market rises to 132.00, your profit will still be limited to the 100 pips because your position was closed at 129.50. If the market moves down below 128.50, your losses will not be limited, unless you had also placed a stop on the open position (see "exiting with a Stop" above.

Using Stops and Limits Together. A common strategy is to place both a Stop and a Limit on the same open position. On the GCI system, the position will be closed by whichever order is reached first, and the other order will automatically be cancelled. This is known as "OCO" or "One Cancels the Other".

Counter