Before developing a trading strategy, a trader should have a working knowledge of technical analysis as well as knowledge of some of the more popular technical studies. Please visit these pages for detailed information.
Sample Strategy 1 - Simple Moving Average
Successful trading is often described as optimizing your risk with respect to your reward, or upside. Any trading strategy should have a disciplined method of limiting risk while making the most out of favorable market moves. We will illustrate one decision making model which uses a Simple Moving Average ("SMA") technical study, based on a 12-period SMA, where each period is 15 minutes. This is one example of a trading decision making strategy, and we encourage any trader to research other strategies as thoroughly as possible.
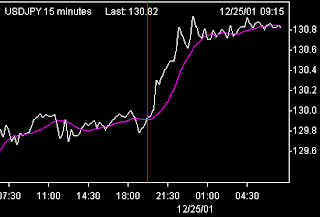
We will use a simple algorithm: when the price of the currency crosses above the 12-period SMA, it will be taken as a signal to buy at the market. When the currency price crosses below the 12-period SMA, it will be a signal to "Stop and Reverse" ("SAR"). In other words, a long position will be liquidated and a short position will be established, both with market orders. Thus this system will keep the traders "always in" the market - he will always have either a long or short position after the first signal. In the chart below, the white line represents the price of USDJPY, the purple line represents the 12-period SMA of USDJPY, and the red line indicates where USDJPY crosses above the SMA, generating a buy signal at approximately 129.90:

This is a simple example of technical analysis applied to trading. Many strategies used by professional traders make use of moving averages along with other indicators or "filters". Note that the moving average method has an element of risk control built in: a long position will be stopped out fairly quickly in a falling market because the price will drop below the SMA, generating a stop-and-reverse signal. The same holds true for a sell signal in a rising market. Note that the SMA is generated automatically by GCI's integrated charting application.
Please review the technical studies described in this site for additional resources on developing technical trading strategy.
Sample Strategy 2 - Support and Resistance Levels
One use of technical analysis, apart from technical studies, is in deriving "support" and "resistance" levels. The concept here is that the market will tend to trade above its support levels and trade below its resistance levels. If a support or resistance level is broken, the market is then expected to follow through in that direction. These levels are determined by analyzing the chart and assessing where the market has encountered unbroken support or resistance in the past.
For example, in chart below EURUSD has established a resistance level at approximately .9015. In other words, EURUSD has risen up to .9015 repeatedly, but has been unable to move beyond that point:

The trading strategy would then be to sell EURUSD the next time it gets close to .9015, with a stop placed just above .9015, say at .9025. This would have indeed been a good trade as EURUSD proceeded to fall sharply, without breaking the .9015 resistance. Hence a substantial upside can be achieved while only risking 10 or 15 pips (.0010 or .0015 in EURUSD).
On GCI's integrated charting system (GCI Multi-Currency Charts), the red support line shown above can be drawn by clicking on the "Trend" button at the top of the chart window, and then drawing a line by clicking the mouse once at the beginning of the line, and again at the end of the line.